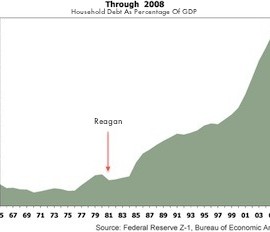
www.ourfuture.org -- It seems that you can look at a chart of almost anything and right around 1981 or soon after you'll see the chart make a sharp change in direction, and probably not in a good way. And I really do mean almost anything, from economics to trade to infrastructure to ... well almost anything. I spent some time looking for charts of things, and here are just a few examples. In each of the charts below look for the year 1981, when Reagan took office. Conservative policies transformed the United States from the largest creditor nation to the largest debtor nation in just a few years, and it has only gotten worse since then:
Click here to read full article...
Read more: debt, inequality, Reagan, reagan revolution, reaganomics, Republican, ronald reagan, , What You Should Know


Got something to say to us? Then send us a letter.
Want us to stick around? Donate to The eXiled.
Twitter twerps can follow us at twitter.com/exiledonline


3 Comments
Add your own1. FrankMcG | June 17th, 2010 at 7:58 pm
Not to defend Ronnie, but that chart makes it looked like Clinton and W tag teamed up to body slam America.
2. Michael | June 18th, 2010 at 12:27 am
@ FrankMcG
That’s the great stuff a conservative-dominated Congress can do for the people.
3. Ten | June 18th, 2010 at 3:47 am
Great pub but a truly lousy premise for this particular article. Reagan had nothing to do with it – the problem is and has always been the progressive’s loopy fiat monetary system, thanks to lead progg Wilson, the jackass.
You’ll do better if you learn that you’ll never credibly pin this country’s demise on one party or the other. The problem is that the whole shebang is simply rigged. Fast forward to Obarky for an entire Gulf full of proof.
Leave a Comment
(Open to all. Comments can and will be censored at whim and without warning.)
Subscribe to the comments via RSS Feed